tl;dr We built an interactive web app for exploring the results of genomics assays: OmicNavigator. You input your data with R, and then OmicNavigator instantly creates a dynamic web app for you to use and share with your collaborators! Available from CRAN and GitHub.
Overview: Facilitating collaborative omics research
The motivation to build OmicNavigator arose from the desire to improve research projects at AbbVie that involved high-throughput omics assays. These are highly collaborative projects that require expertise of both disease specialists and bioinformaticians. The disease specialists need to explore the results in-depth, but they are often dependent on the bioinformaticians to query and visualize the data. And the bioinformaticians’ time is best spent on performing statistical analyses and generating custom visualizations. Any time spent generating generic boxplots or yet another basic Shiny app is time they could have spent on more high-value activities. OmicNavigator to the rescue! OmicNavigator aims to facilitate these routine interactions and streamline the research project for all participants:
Disease specialist: Instead of emailing your collaborator each time you want to explore a new gene of interest, you can open your browser and explore all the study results whenever you want. You can also perform your own filters to subset the data to the genes you think are the most interesting, and export the plots to include in your presentations.
Bioinformatician: The next time you perform a differential expression and enrichment analysis, you can send your collaborators to your OmicNavigator web app to explore the results. You don’t have to become a web dev expert. You can instead spend your time creating custom visualizations, which you can then integrate into OmicNavigator, and your collaborators will be able to auto-generate your plots for whichever genes they dynamically select in the app.
Manager: OmicNavigator is able to display the results of many studies from the same interface. You just have to choose which study to explore in the drop down menu. Instead of having the results from each project scattered in different locations, you can have them all in one place.
Data curator: The data in OmicNavigator studies are organized in a uniform way. Thus instead of having to manually curate each project’s data, you can write scripts to automatically convert OmicNavigator data files into the format you need.
Web developer: If you’re a web developer that needs to integrate results stored in OmicNavigator into your application, you don’t need to worry about learning R or waiting for the bioinformatician to package the data into the format you need. The data in OmicNavigator studies is accessible from a standard API and exportable in many formats, e.g. JSON (more on that below in the section Architecture). You can have your app query the OmicNavigator API to always automatically download the latest data.
App features
The app has two main panes: one for differential expression results and one for enrichment results.
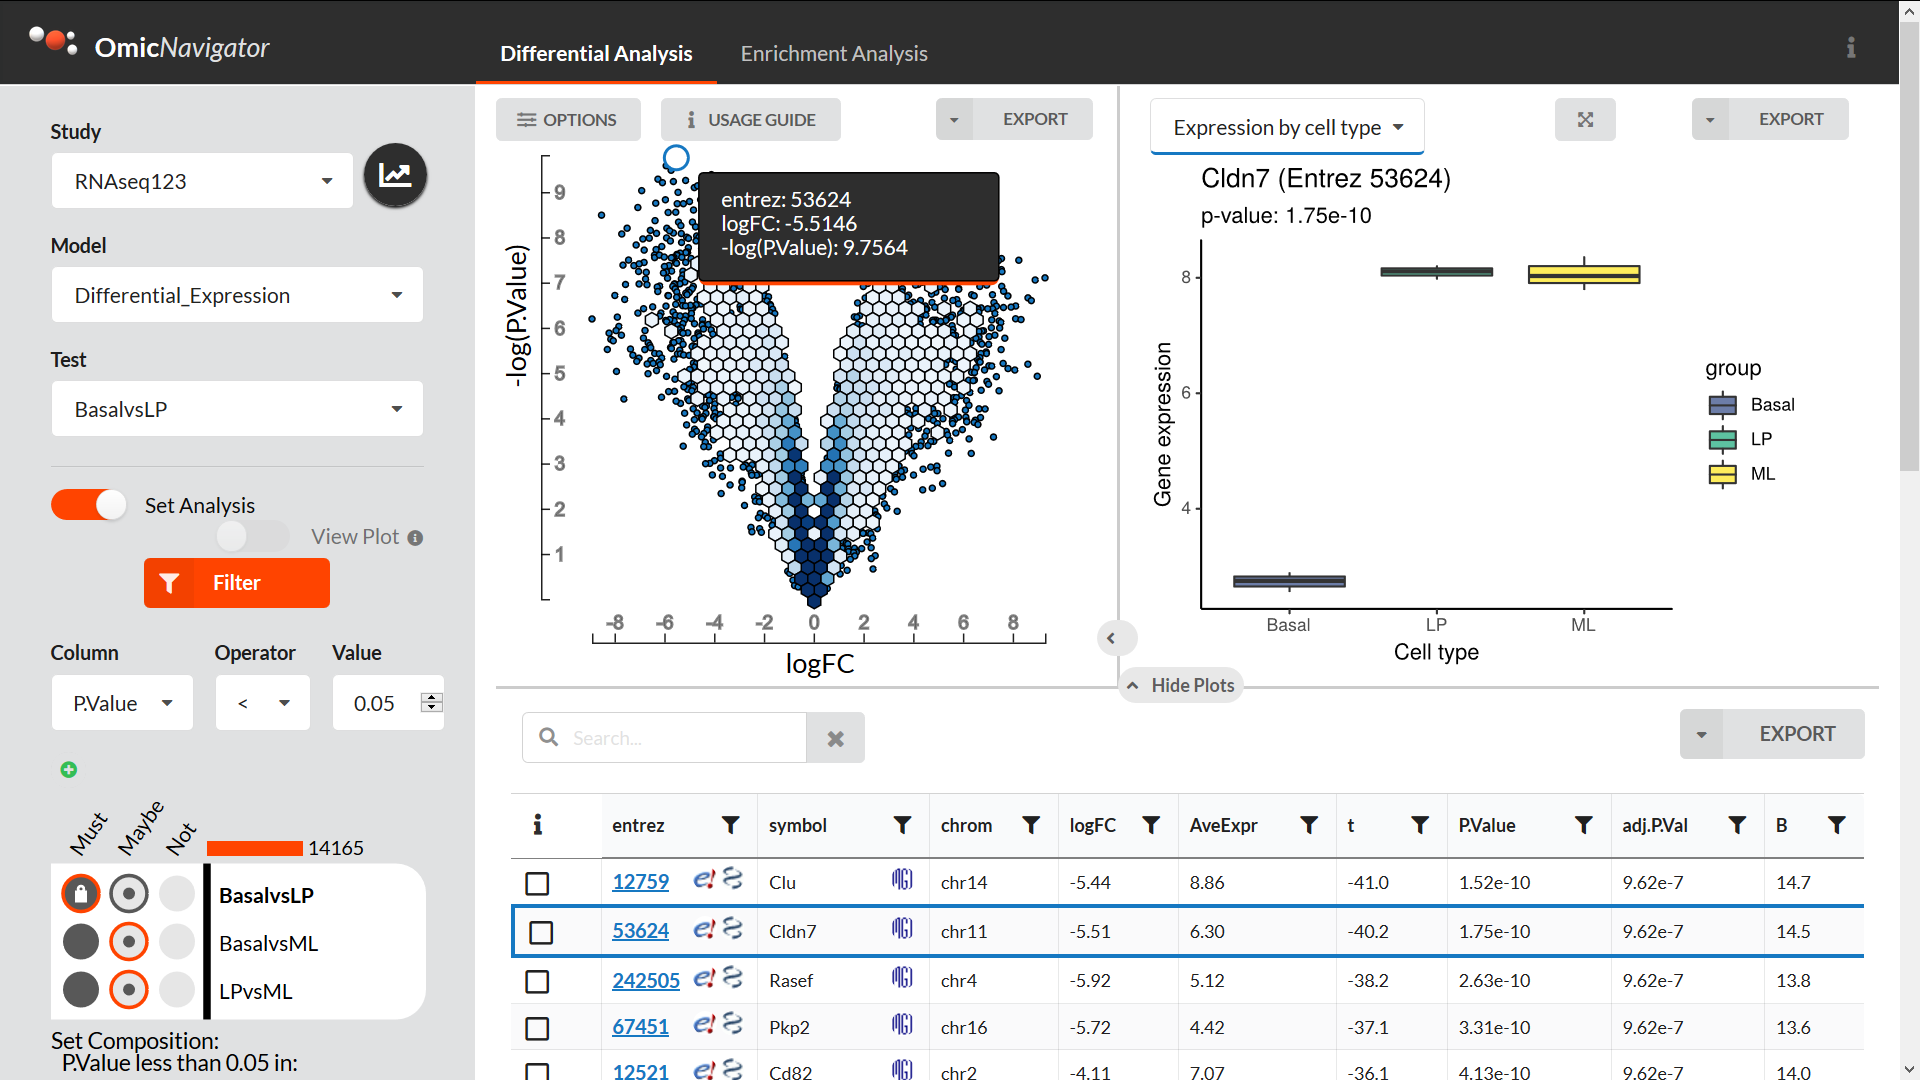
The differential expression pane includes:
a dynamic results table that you can search, filter, sort, etc.
an interactive scatter plot. If you drag and select points in the plot, the table is automatically filtered to only include these features. A typical use case is creating a “volcano”-style plot, but you can compare any two numeric columns that you like
Custom R plots. If the bioinformatician has added any custom plots, you can select any gene to visualize it (and export the plot if needed)
A filter to subset genes based on the results from all the available tests. This makes it easier to e.g. find genes that are significantly differentially expressed in one test but not others
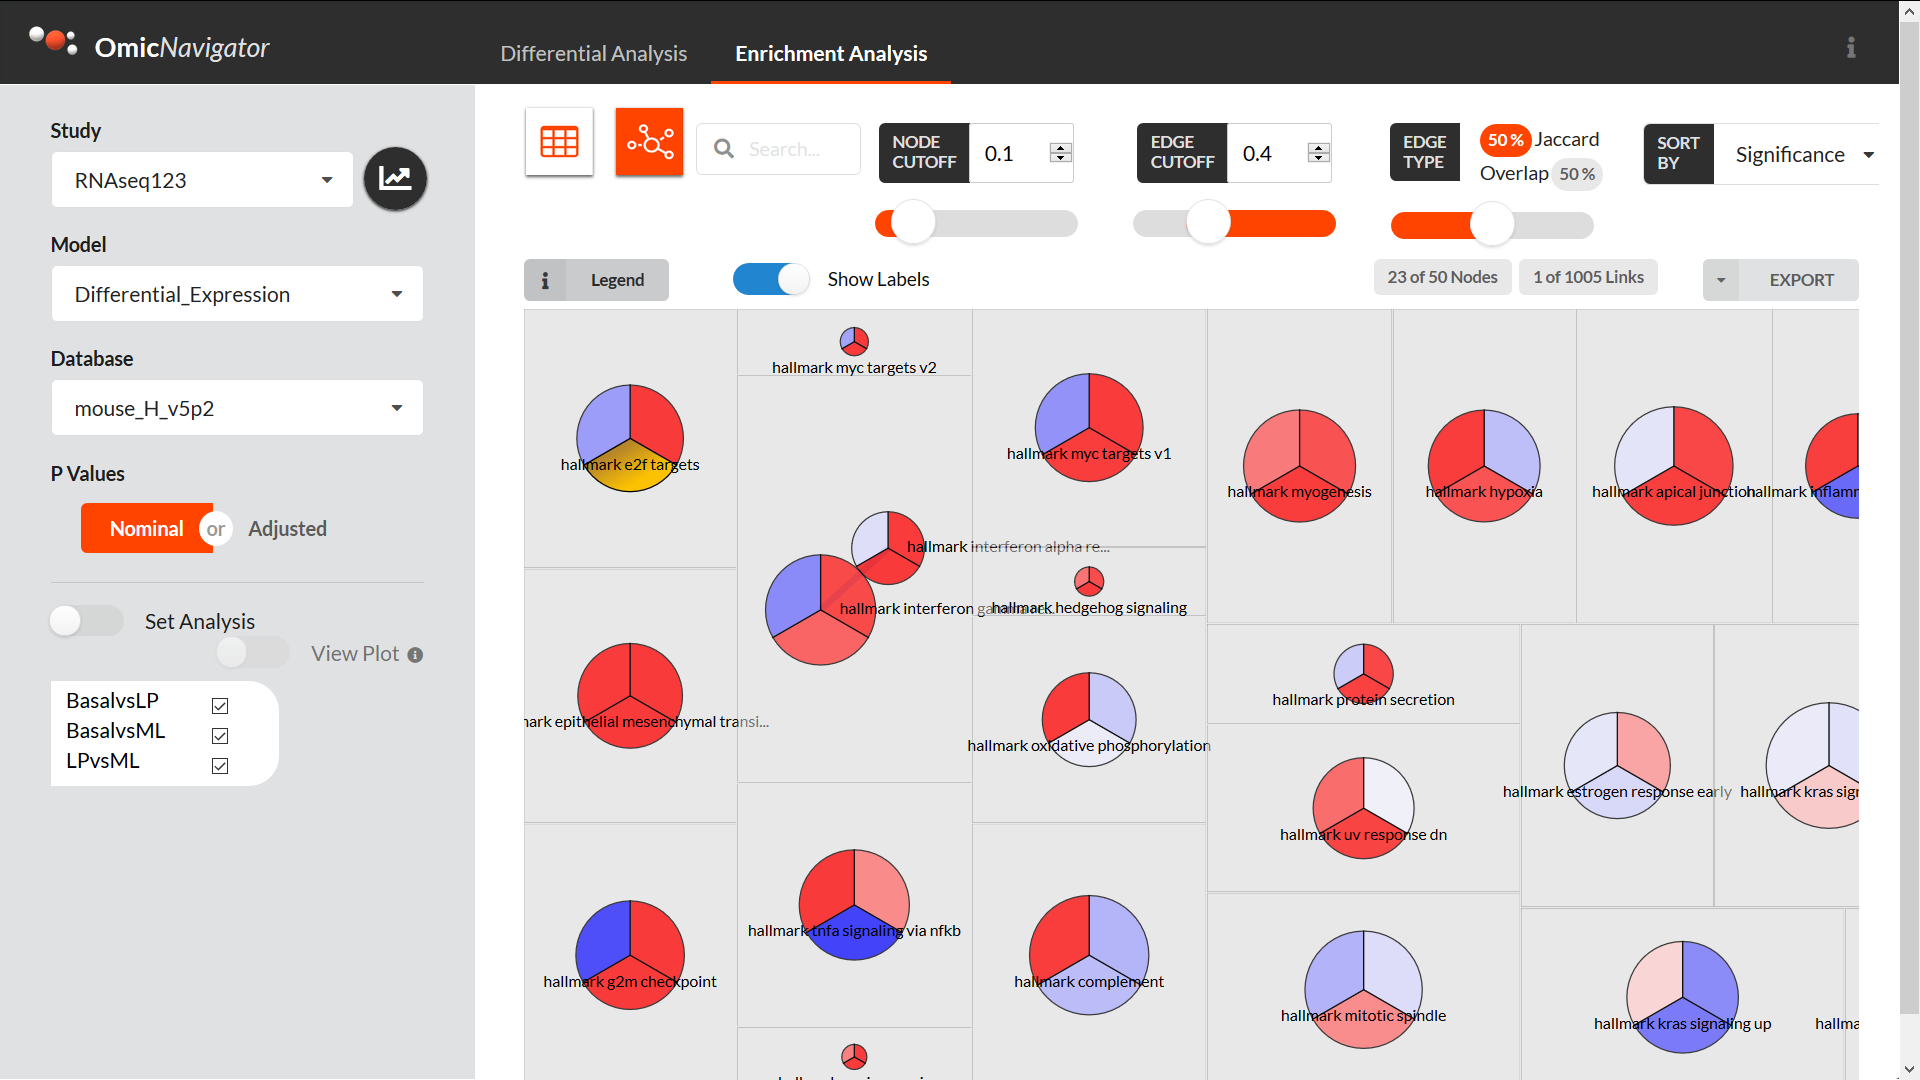
The enrichment analysis pane includes:
a dynamic table with the enrichment results that you can search, filter, sort, etc.
a network view for visualizing the relationships between the various terms used for enrichment (e.g. how many genes are in common between the terms)
a “barcode” view for investigating the genes driving the enrichment of a term in an interactive barcode plot
A filter to subset genes based on the enrichment results from all the available tests. This makes it is easier to e.g. find terms that are significantly enriched in one test but not others
There are even more existing features, e.g. custom plots for visualizing multiple features at once, and more features in development, but the above should give you a good sense of the app’s capabilities.
Create an OmicNavigator study with your own data
After performing the statistical analysis, the bioinformatician deposits the data into an OmicNavigator study. This should require minimal data manipulation since OmicNavigator provides helper functions to ingest data frames directly in R. Once assembled, OmicNavigator exports the data as an R package for consumption by the web app.
And you don’t need to include every single piece of potential data. The app only enables the features that are supported based on the available data. For example, if you didn’t perform an enrichment analysis, you can still use OmicNavigator to share differential expression results.
Below is a quick start guide to give you an idea of how this works. To learn more, check out the extensive User’s Guide and example study.
# Install and load the package
install.packages("OmicNavigator", dependencies = TRUE)
library(OmicNavigator)

# Create a very minimal study with a single results table
quickstart <- createStudy("quickstart")
data("RNAseq123")
head(basal.vs.lp)
resultsTable <- basal.vs.lp[, -2:-3]
quickstart <- addResults(quickstart, list(model = list(test = resultsTable)))
installStudy(quickstart)

# (optional) Install the example study RNAseq123 which demos many of the app's
# available features
install.packages(c("gplots", "viridis"))
tarball <- "https://github.com/abbvie-external/OmicNavigatorExample/releases/latest/download/ONstudyRNAseq123.tar.gz"
install.packages(tarball, repos = NULL)

# Install and start the web app
installApp()
startApp()
Architecture
The central piece of infrastructure is OpenCPU, an amazing framework for creating web apps with R. The basic idea behind OpenCPU is that is exposes all the functions in the R packages installed on the machine via a uniform HTTP API. This makes it possible for web apps to harness the power of R without R developers having to perform extra steps to make their code deployable.
This is an incredibly powerful paradigm. It lets me as the R developer use all the tools I am familiar with. My code is organized as an R package, my functions are documented, and I’m able to easily test my functions since they return standard R objects like lists and data frames. Then my collaborators developing the front-end JavaScript app are able to call my R functions via HTTP and request JSON formatted data in return. They don’t have to worry about R-specific things like data frames and factors; in fact, they don’t even need to install R! They are able to focus on the front-end using whichever tools they prefer, in this case React and D3.
And because OpenCPU is serving the R functions via a standard HTTP API, other developers can query and access the data for inclusion in other apps throughout the organization. By default OpenCPU provides many options for output formats, including JSON, NDJSON, and protocol buffers.
In summary, OpenCPU allows us to take advantage of the best of the R and JavaScript ecosystems.
Comparison to other dashboard-like tools
There are lots of options for creating dashboards. OmicNavigator aims to complement these existing options. OmicNavigator provides dynamic web app capabilities to the R user while also allowing them to customize the app with bespoke plotting functions.
To best illustrate how OmicNavigator fits in, below I compare it to some other available options:
Point-and-click GUIs: While the app itself is point-and-click, it is created and deployed by the R user. This allows them to easily update their study. When new data arrives, or they add a new statistical model, simply update the data-in script and re-export the OmicNavigator study
Dashboard frameworks: Frameworks like Shiny and streamlit enable you to quickly create a custom dashboard from scratch using R and Python, respectively. This is super useful, but can also be time-consuming. OmicNavigator attempts to cover the common use cases of reporting differential expression results so that the bioinformatician can spend their time developing bespoke dashboards for the unique aspects of a particular study
Acknowledgements
OmicNavigator is the brain child of Brett Engelmann. The web app has been primarily developed by Paul Nordlund, Terry Ernst, and Joe Dalen. Additional contributors include Justin Moore, Akshay Bhamidipati , and Marco Curado.
And of course thanks to AbbVie for supporting the development of this open source tool!